
Sections Assisted Review Manual
Manual informationAssisted Review Manual
1.1 | August 30, 2021 | Rebranded adhering to the latest Conduent brand central documentation standards/guidelines. | Technical Writer
Document conventions
Convention | Explanation |
|---|---|
Bold | For file names, commands, fields, menus, options, and window names. |
Courier New | Commands as you should type them. |
Lucida Console | Example output generated by the system. |
Italics | For configuration variables, including variable portions of file names and URLs. Also indicates a document name. |
Note / Blue Callout | The Blue Callout text indicates information that is of special interest or importance, an idea that could be useful or additional information about a product or a feature. |
| The Caution icon along with the text indicates actions that can lead to problems in system operation or configuration settings if the instructions are not followed properly. |

Revision history
This section tracks the initial creation of the document after each major version thereafter.
Ver: | Date | Description | Reviewed / Approved By |
|---|---|---|---|
1.0 | Apr 12, 2013 | Initial Version | Team |
1.1 | August 30, 2021 | Rebranded adhering to the latest Conduent brand central documentation standards/guidelines. | Technical Writer |
Overview#
The Viewpoint Assisted Review (‘VAR’) module combines proven analytics and machine-learning techniques to assist your review team in achieving consistent, predictable decisions and document categorization. By ‘learning’ the decisions made by your expert review team on the Seed View of data, the assisted review workflow analyzes the remaining documents and categorizes them based upon the decisions made by the human team. By combining user expertise and the advanced technology of Viewpoint Assisted Review, document review is fast, efficient and consistent.
Terms to Know#
- Assisted Review Set: The combination of documents used to train the system, sample set(s) used to validate results and any applied settings which are used to define the model. The Model will contain the index of documents which will ultimately be used to run the VAR predictions.
- Expert Reviewers: VAR relies on a small set of decisions made by human reviewers. Therefore, the success of the VAR process is only as good as the accuracy of the human reviewers. For this reason, it is imperative to have the most qualified set of reviewers making the calls necessary to train VAR. To ensure coding consistency, rigorous quality control protocols are recommended. Additionally, it may be helpful to rely upon tagging provided by a single expert reviewer.
- Positive and Negative Tags: VAR can be used to predict one of two calls along a single dimension for the Target population of documents. These calls are known as the Positive and Negative tags. It is necessary to define one’s Positive and Negative tags before beginning this process. Theoretically these two tags can be defined as anything, but the most typical scenario is “Relevant” (or “Responsive”) as the Positive tag and “Non-Relevant” (or “Non-Responsive”) as the Negative tag.
These two tags should be set up as Production Tags in the View Manager. It is important to note that the Positive and Negative Tags must be diametrically opposed. For example, the two tags cannot be Responsive and Privileged, since those two values are not necessarily opposed to each other. Production Tags other than the Positive or Negative tags will not be considered when building a VAR Model.
- Target View: The Target View is the body of documents which will be tagged through the VAR process. This View is typically built after filtering (i.e., de-duplication, date filtering, keywords, etc.) is applied. In other cases the Target View may not be subject to any prior filtering.
- Source View: The Source View is the population of documents used as the source documents for the Sample View and Seed View. In most cases, the Source View is the same as the Target View; however, Viewpoint supports workflows where the two views might be different.
- Sample View: The Sample View is a completely random View built from the designated Target View. The Sample View serves multiple purposes. Initially, the Sample View will be used to determine the ratio of Positive to Negative documents in the Target View. This ratio is one of the factors dictating the size of the Seed View.
Additionally, once the VAR predictive Model has been fully trained, the Sample View will be used to validate the results and establish Performance Metrics. By default the Sample View will contain 2,000 documents randomly selected from the Source View; however, this number can be adjusted depending on the VAR use-case and user preference.
If using VAR to cull documents from a review set or to make definitive Responsive/Not Responsive calls, a larger Sample View may be preferable for validation purposes. The size can be increased for maximum defensibility.
Note: To adjust the size of the Sample View, alter the value of the Size of Sample View option located in the Options menu.
- Seed View: The Seed View is a sample of documents that contains a statistically sound number of representative documents from the Source/Target View to be used as the foundation for the VAR training process. The number of documents in the Seed View is based on the observed ratio of positive to negative documents in the Sample View and the target margins of error and confidence level for the Seed view.
When building the VAR predictive Model, Viewpoint will analyze the text content of the documents contained in the Seed View and compare that content against the Positive and Negative tags applied by the expert reviewer to build an understanding of what type of content is associated with the Positive and Negative tags.
- Smart Sampling: To maximally diversify the documents in the Seed View, VAR offers the option of utilizing the relational data gathered from the ND (Near-Duplicate) Similarity Viewer, Email Thread Viewer and Concept Analyzer. Utilizing this data will introduce highly generalizable data points to your Seed View which increases the representativeness of the Seed View in relation to the Target/Source View.
For this reason, it is recommended to build these three advanced tools for your entire Target population of documents before beginning the VAR process. If all three tools are built the documents in the Seed View may be comprised of the following four groups:
- A completely random sample of documents which make up the base number of documents for the Seed View. Any additional documents will come from one of the three groups below.
- A sampling of documents from different ND Groups. As documents in the same ND Group will be highly similar to each other, the Seed View could conceivably contain many documents from one ND Group and none from another. Using the ND Groups option will help ensure instead that one document from each ND Group will be used for this portion of the Seed View.
- A sampling of documents from ETA threads containing the largest number of included emails. Most emails in a thread will contain material that is redundant to material from earlier members of that thread. The Seed View could contain many documents from one thread and none from another, but using the ETA Thread option will help ensure that only the last email from the ETA Threads will be contained in this portion of the Seed View.
- A sampling of documents from different Concept groups. As documents in the same Concept group may contain similar content, the Seed View could contain many documents from one Concept group and none from another. Using the Concept Groups option will ensure that one document from each Concept group will be used for this portion of the Seed View.
- Negative Corpus: The set of negatively tagged documents from the Seed View.
- Negative Score: Probability threshold for a document to be assigned a negative Predicted Tag. For example, if the negative score is set to 40, any document with a probability of 40 or less will be assigned a negative Predicted Tag (e.g., Non-Relevant).
- Positive Corpus: The set of positively tagged documents from the Seed View.
- Positive Score: Probability threshold for a document to be assigned a positive Predicted Tag. For example, if the positive score is set to 80, any document with a probability of 80 or more will be assigned a positive Predicted Tag (e.g., Relevant).
- Predicted Tag: The top level tag assigned to each document in the Target View by the VAR application.
- Production Tag: A document’s current top level Production Tag selected by a human reviewer.
- Token: An alphanumeric string of characters, roughly a “word,” used in the prediction analysis. For example, each of the three following strings would be considered one token: legal, Smith, p455w0rd. Strings containing only digits like ‘2013’ will be ignored by default.
Access and Permission#
To access Viewpoint Assisted Review, the user or user assigned role must be given the Assisted Review permission located in the Advanced Tools section of the Security Manager.
Note: If the permission is being granted to the end user, visibility can be restricted to the Company and/or Project.
Walkthrough#
Opening Assisted Review#
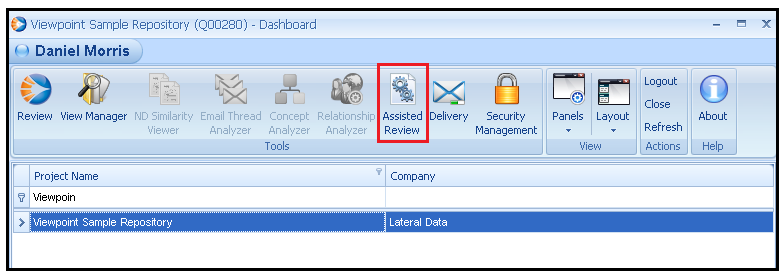
To launch Viewpoint Assisted Review, select the Assisted Review button on the Dashboard, as shown in the following screen:
 Create Assisted Review Set#
The first stage of any Assisted Review process is creating the Assisted Review Set.
- Select the Create New icon or right-click within the Assisted Review Set grid.

- You can also select New, the following screen appears:
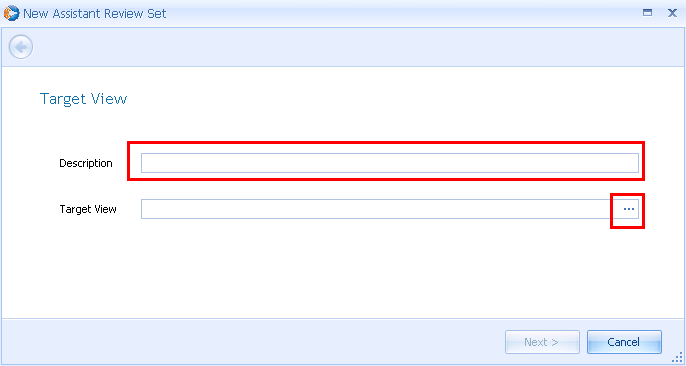
- Enter the Assisted Review Set description in the provided field.
- Click the ellipsis to browse and select your Target View from the populated Source Selector. The Wizard may display a message at the bottom indicating that documents exist within the Target View that do not contain text and will not be included in the VAR analysis. You may wish to extract text or the OCR documents that are not containing text using the Processing module, or if you wish the VAR module to attempt to make a prediction about these documents.
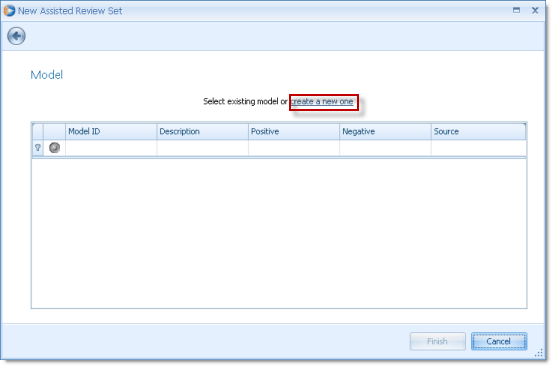
- Each Assisted Review Set is linked to a Model. Users can create a completely new Model or select an existing Model, as shown in the screen.
- To create a new Model, either click the ‘create a new one’ hyperlink located over the Model grid, or right click and choose the ‘New’ option.
- Choosing a new Model will launch the New Model Wizard. Enter a description to describe the Model (e.g., ‘Relevancy Model for Client Docs’). Users have multiple methods to create a new Model:
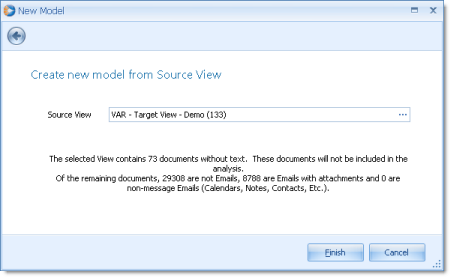
- Use Source View: This option allows the user to create a new Model by creating a Seed View from a ‘Source’ view. This Source View will typically be the same View as the Target View, but it is possible to create a Seed View from documents other than what are contained in the Target view. Choosing this option and clicking ‘Next’ will progress the user to the ‘Create new Model from Source View’ screen. By default, the Target View will be selected as the Source view.
If this option is selected, the ‘Specify test sample for Performance Metrics’ option will be disabled. This is because the user will be required to create a new Sample View from the main screen in order to progress further with the Assisted Review set. Click Finish once the desired Source View is selected:
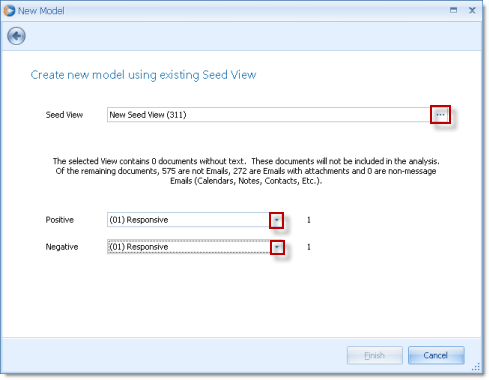
- Use Existing Seed View: This option allows the user to create a new Model by selecting an existing View to use as the Seed view. Selecting this option will progress the user to the ‘Create new Model using existing Seed View’ screen. Select an existing View to use as the Seed View using the ellipses. Users are also required to designate the Positive and Negative Production Tags used to code the existing view.
If this option is selected, the ‘Specify test sample for Performance Metrics’ option will be enabled and the user may select an existing View to use as a test set for the purpose of using the VAR Performance Metrics information.
- Click ‘Finish’ to complete selection of the Seed View to use for the Model.
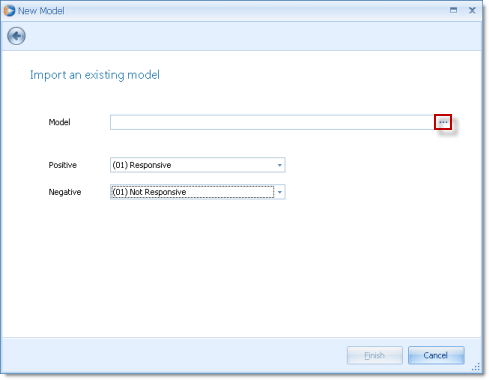
- Import an Existing Model: This option allows a user to import a Viewpoint Assisted Review Model file to use as the Model for the Assisted Review Set. Selecting this option will prompt the user to select a Model file to use as the Model. Users must have previously exported a VAR Model to file from the current or other Viewpoint Review project. Users are required to indicate which Production Tags should be used as the Positive and Negative tags for the new Assisted Review set.
If this option is selected, the ‘Specify test sample for Performance Metrics’ option will be enabled and the user may select an existing View to use as a test set for the purpose of using the VAR Performance Metrics information.
- Click ‘Finish’ to complete the ‘New Model’ wizard.
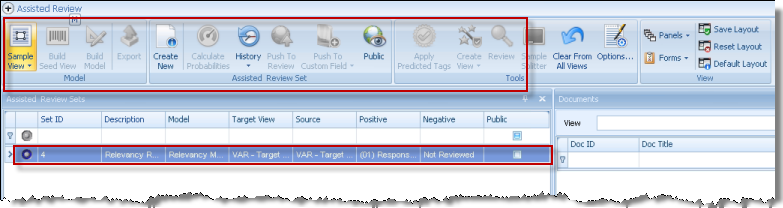
- Once the New Model wizard is completed, a new entry will exist in the ‘Assisted Review Sets’ grid. Different options will now be available on the Assisted Review menu bar depending on the method used to generate the new Model.
Build Sample View#
If the user elected to create a new Model using the ‘Use Source View’ option during the New Model Wizard, the ‘Sample View’ button in the ‘Model’ section of the menu ribbon will be enabled. This option allows the user to create a new Sample View to be used measure the underlying relevancy rate of the selected Target/Source View and also for the purpose of measuring the VAR Model effectiveness using the VAR Performance Metrics information.
- Click the ‘Sample View’ button on the menu ribbon. A dropdown will appear allowing the user to select the following options:
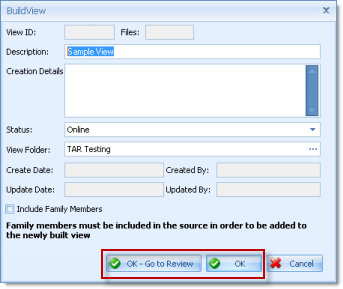
- Build Sample View: This option launches the ‘Build View’ wizard which will create a new Sample View composed of randomly selected documents from the selected Source view. Users may choose a name for the Sample View and folder location. Users also have the option to include family members in the Sample view, however it is not recommended to use that option. Users may choose ‘OK – Go to Review’ to launch the linear Review module using the newly created view, or ‘OK’ to simply save the View and finish the wizard.
- Select Existing View: If the user already has a Sample View created through other means, they may choose this option to designate an existing View as the Sample view. This option should generally be used by advanced users only as failure to select a proper sample from the Target/Source View may bias the Performance Metrics such that they do not accurately reflect the actual effectiveness of the Assisted Review model.
Sample View Tagging#
After the Sample View is created, the expert reviewer(s) should be notified and review of the Sample View should begin. Typically the review is conducted from the linear Review module.
Each tagging call made on the Sample View documents must be one of the two Production Tags designated for the Assisted Review analysis.
It is recommended that reviewers conducting the Sample View review analyze each document on its own merit and not in the context of its family members. Coding each document individually will result in a more accurate VAR Model.
Once review of the Sample View is completed, the user may return to the Assisted Review module in order to complete the next step of the Assisted Review process: building the Seed View.
Build Seed View#
- Select the Build Seed View icon from the tool bar to launch the ‘Seed View Wizard’.

- Click Next to use the default settings.
Note: If any advanced options are desired, a definition of each can be found in the Advanced Settings section below. Also, if you wish to select an existing View to represent your seed, you need to select the Advanced option.
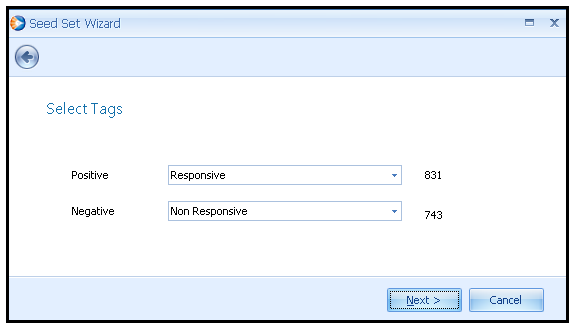
- Select the Positive and Negative Tags from their respective drop down menus and click Next.
Note: The numbers shown next to each tag represent the number of documents tagged accordingly in the Sample View.
- If not already completed, consider building the ND, CA and ETA advanced tools for the selected Source View. Built tools will display in green. Unbuilt or incomplete tools will display in red and those that are in progress will display in yellow.
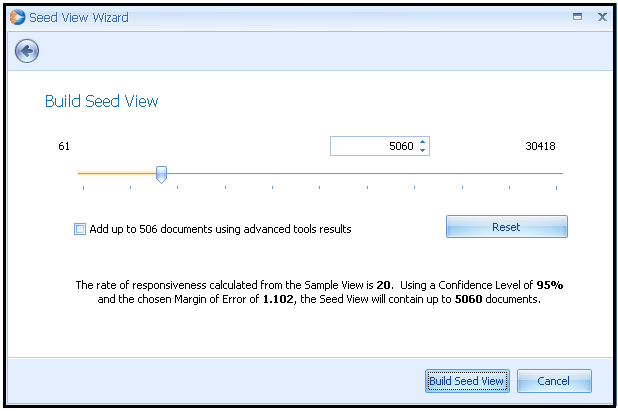
- Click Next, the recommended Seed View size will display in the box, as shown in the following screen.
- If desired, the user can adjust the number of documents using the slider or by manually inputting a number in the box. The changes in the Margin of Error for the rate of responsiveness derived from changing the Seed View size will be shown at the bottom of the window. Select the check box to add in documents for Smart Sampling described above.
Note: If the number is set too low and, therefore, falls outside the range statistically supported by the suggested confidence level and margin of error, the message text will turn red.
- When ready, click Build Seed View.
- Select a desired folder for the Seed View and click OK.
Note: It is recommended at this point not to include family members in the Seed View, as this may increase the Seed View size significantly beyond what is necessary for training purposes.
Seed View Tagging#
After the Seed View is created, the expert reviewer(s) should be notified and tagging should begin. Each tagging call made on the Seed View documents must be one of the two Production Tags reserved for Assisted Review analysis. When the Seed View has been tagged entirely, proceed to building the Model below.
Build Model#
A predictive model needs to be built once the review of the Seed View has finished.
- Select the Build Model icon from the tool bar.

- Click Next to use the default settings.
Note: If any advanced options are desired, a definition of each can be found in the Advanced Settings section below.
- The Positive and Negative Tag counts on this page will be updated to reflect the Seed View tagging.
- Click Build Model.
Calculate Probabilities#
Now that the Model has been calculated, predictions can be applied to a set of documents. It is the best practice to first calculate predictions against the Sample View in order to validate the Model and make necessary adjustments. Once validated, predictions can be applied to a larger set of documents (i.e. the Target View).
- Select the Calculate Probabilities icon from the tool bar to launch the Prediction Wizard.

- Select a View to Calculate Probabilities on. Typically this will be your Sample View initially, and once satisfied with the results, the Calculate Probabilities function can be applied to the entire Target view. Click Next to use the default settings.
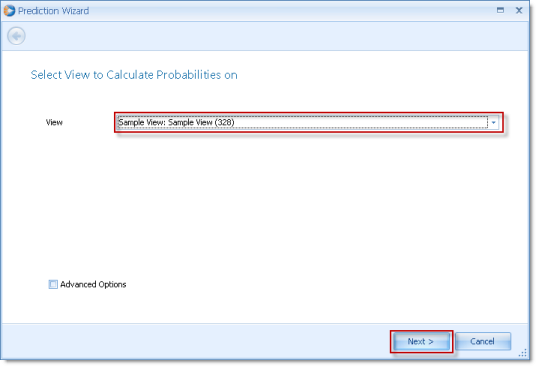
Note: If any advanced options are desired, a definition of each can be found in the Advanced Settings section below.
Once the process is completed, the Probability and Predicted Tag fields are populated for that View and are visible within the VAR application. Additional steps are needed in order to make those values visible to reviewers within the Review module. The tools used to populate those values to Review are discussed in the ‘Tools’ section of this manual.
The user will also have access to a number of reports and panels to review and validate results. Additional information about these fields and reports is discussed below.
Result Analysis#
Overall Probability#
Where possible, each document in the Target/ Sample View is assigned a probability score between 0 and 100. This value can be seen in the Probability field. Depending on the probability score, a document will be predicted for the Positive Tag, Negative Tag, or inconclusive. You can see these values in the Predicted Tag field. Documents with scores closer to 100 are most likely Positive while those with scores closer to 0 are least likely Positive. Documents determined to be inconclusive will be given the default Production Tag as their Predicted Tag, which is typically Not Marked.
There are scenarios in which a probability score cannot be determined for a document. Typically these will be documents which fall out of your analysis based on the options you set. Examples are documents which do not contain enough tokens for analysis or documents which are too large for analysis.
The document probability here is based on the probabilistic latent semantic analysis (PLSA) algorithm.
Performance Metrics#
The Performance Metrics table and chart should be used to validate your results. This panel provides a detailed report of the performance of your Assisted Review model. Each field of the Performance Metrics table is defined, as follows:
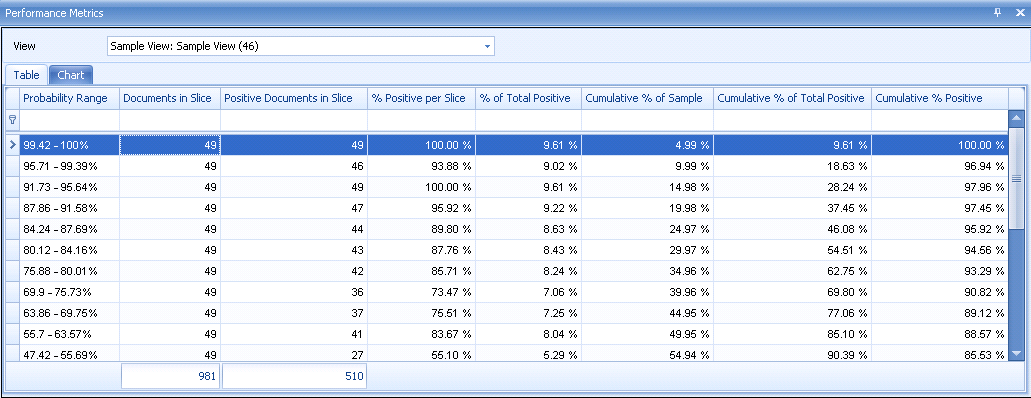
- Probability Range: Probability range for the specific percentage of the Sample View.
- Documents in Slice: The number of documents within each population slice. Numbers for each slice should generally be similar to one another, but may not always be exactly the same, because documents with exactly the same probability are never separated into different slices.
- Positive Documents in Slice: The number of documents in the slice tagged positive by the reviewer.
- % Positive per Slice: Percentage of document in the slice tagged positive by the reviewer. Total Documents Tagged Positive divided by Total Documents.
- % of Total Positive: Number of documents tagged positive in the slice divided by the total number of positive tagged documents in the entire Sample View.
- Cumulative % of Sample: Cumulative total of documents in each slice, from top to bottom, divided by total number of documents in the Sample View – i.e., the percentage of the Sample View represented by Slice 1 through Slice X.
- Cumulative % of Total Positive: Cumulative total of positive documents in each slice divided by total number of positive documents in the Sample View. This number roughly corresponds to Recall.
- Cumulative % Positive: Cumulative total of positive documents in each slice divided by cumulative total of documents in each slice – i.e., the overall concentration of positive documents in Slice 1 through Slice X. This number roughly corresponds to Precision.
Generally, the values in the % Positive per Slice field should decrease as the Associated Probability ranges decrease. Likewise, the values in the Cumulative % of Total Positive should approach 100% as the Associated Probability range decreases. When this occurs as expected, the system has made accurate generalizations about the probabilities assigned to each document. If the values do not descend over the given range, additional document training may need to occur.
In addition, the Performance Metrics chart shows you the Precision and Recall in relation to the probability score.
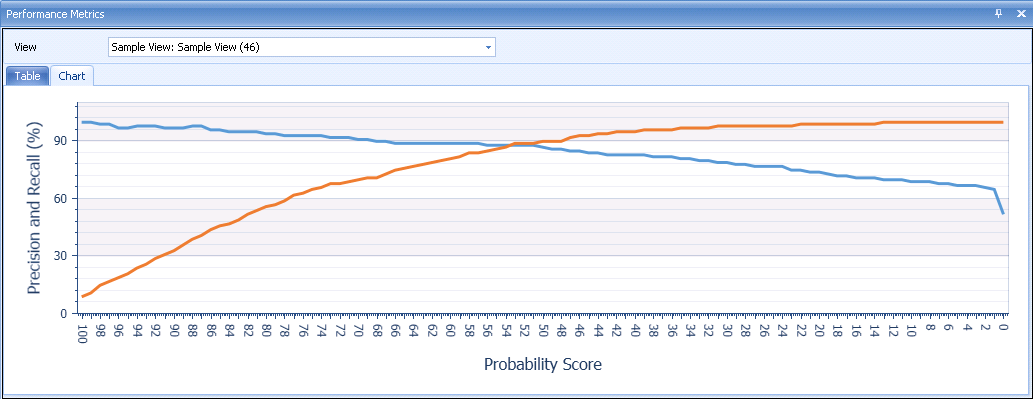
Once your results have been validated through the above observations, you can use the Performance Metrics panel in two ways:
- Create prioritized groups of documents, based on probability ranges, that can be strategically routed to review teams for an efficient and cost effective review workflow, or
- Determine the acceptable probability range(s) for applying Predicted Tags. For instance, in the screen shot above, you may determine that a ‘precision’ of 77.06% is high enough to justify tagging all documents with a probability of 63.86% or higher as Positive. Similarly, you may judge that a ‘recall’ of 93.5% is high enough to justify tagging all documents with a probability of 20% or lower as negative. Then, any document with a probability between 21% - 85% may be batched out for manual review. These threshold judgments should be tailored to the specific goals and constraints of the matter at hand.
Additional information regarding Performance Metrics is available in the ‘Viewpoint Assisted Review – Understanding and Interpreting Performance Metrics’ document available on the support website.
Probability Breakdown#
The Probability Breakdown panel shows detailed performance information broken down by probability bands. This lets you see at a glance the general distribution of the population in terms of probability scores. Generally, a successful Model will start to form a u-shaped graph, having more documents with very high and very low scores. High and low probability scores suggest the system is confident with its decision, whereas a high frequency of mid-range scores suggest the system is less decisive.
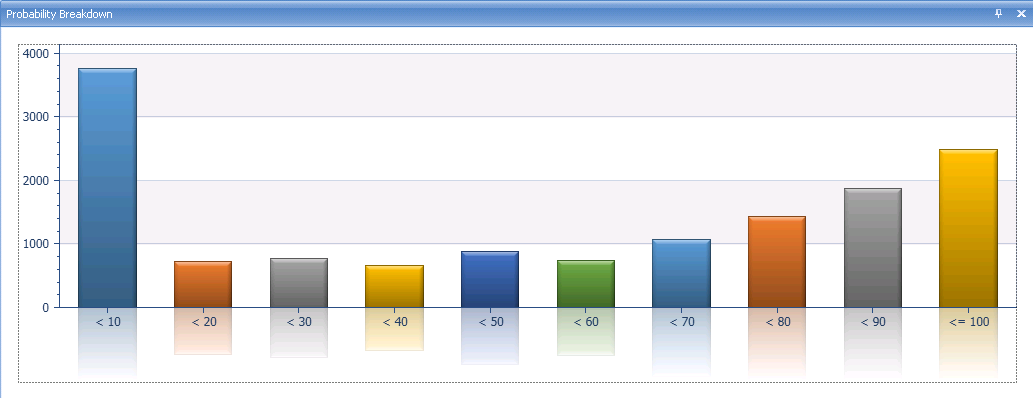
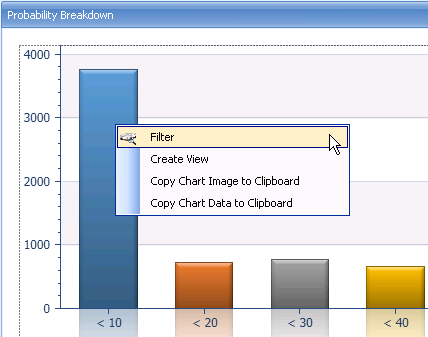
Note: Right-click on a probability bar to filter your document panel or create a View of the respective documents. You can also copy the chart image or data to your clipboard.
Production Statistics#
The Production Statistics panel is a side by side comparison of the human decision (i.e. Production Tag) and the probability score (i.e., Predicted Tag). This chart is useful for quickly visualizing conflicts between human and machine tagging. The bar chart displays two bars for each production tag option – positive (i.e. Responsive) and negative (i.e. Not Responsive). The left bar of each pair represents the total documents tagged by the reviewer (i.e. Production Tag). The right bar of each pair represents the corresponding Predicted Tags (i.e., machine decision).
Right-click on a specific segment of the bar chart and select Filter to filter the Documents grid by that specific Production and/or Predicted Tag. It’s good practice to review the direct conflicts to determine who was correct – the reviewer or system.
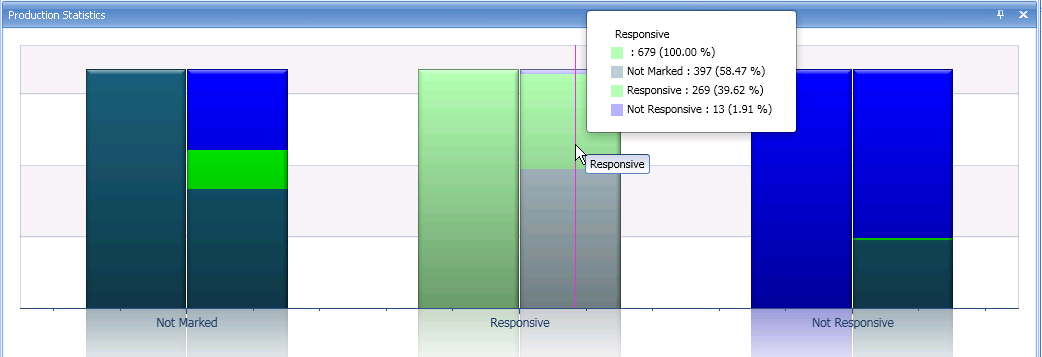
Note: If your source View contains documents which are not marked or have been tagged with a value other than the positive or negative tag, those will also be represented in the graph with another pair of bars.
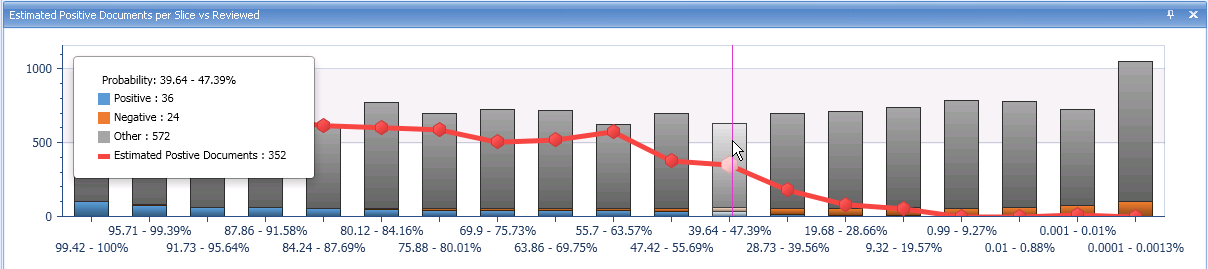
Estimated Positive Documents per Slice vs Reviewed#
The Estimated Positive Documents per Slice vs. Reviewed panel is a graph that indicates the estimated total positive documents per slice in comparison to the actual documents tagged. The colored graphs correspond to the portion of the slice that is tagged positive or negative. The red line indicates the expected level of positive documents based on the most recent model.
If documents are being actively reviewed, users should reference this graph to see how actual positive totals are measuring to estimated positive totals.
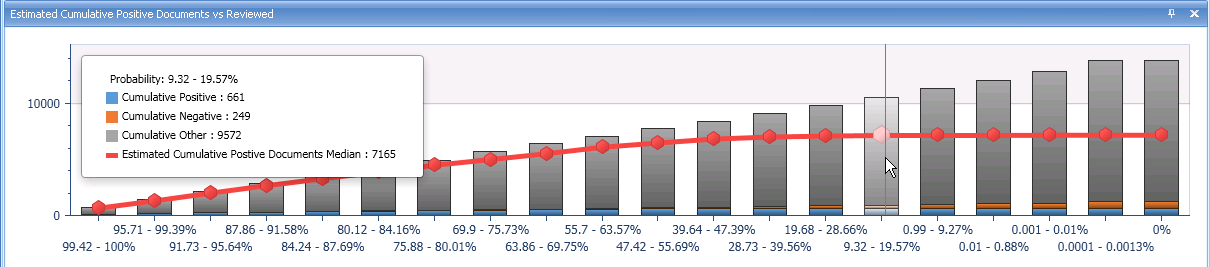
Estimated Cumulative Positive Documents vs Reviewed#
The Estimated Cumulative Positive Documents vs. Reviewed panel is a similar graph except it tracks the cumulative estimated total positive documents and actual tagged documents across the entire view. The colored graphs correspond to the cumulated totals tagged positive or negative. The red line indicates the expected level of cumulative positive documents based on the most recent model.
If the documents are being actively reviewed, users should reference this graph to see how actual positive totals are measuring to estimated positive totals.
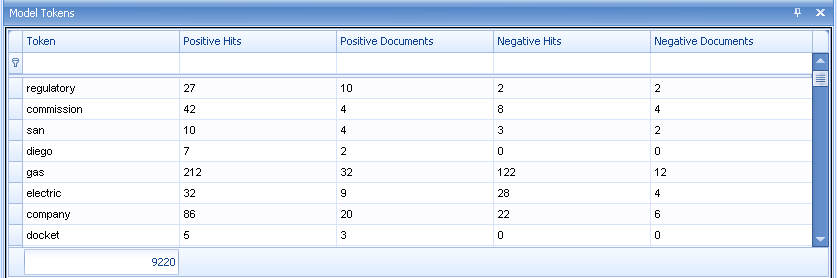
Model Tokens#
The Model Tokens Panel lists each identified token in the selected Modeling Set. The Positive Hits field corresponds to the number of times that token occurs in documents tagged as Positive. The Positive Documents field corresponds to the number of Positive documents that token appears in. The Negative Hits field corresponds to the number of times that token occurs in documents tagged as Negative. The Negative Documents field corresponds to the number of Negative documents that token appears in. The probability of each token is informed by these values.
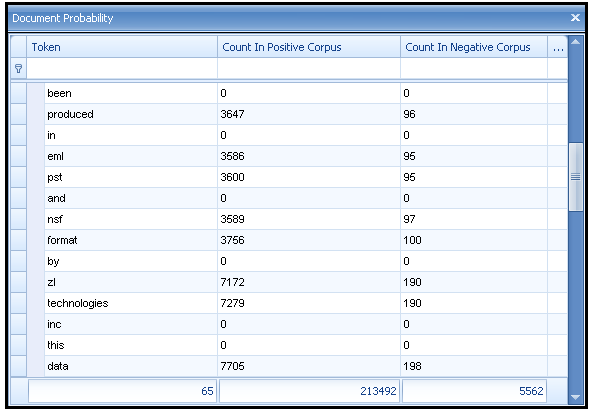
Document Probability#
The Document Probability panel lists the tokens identified in the specific document selected in the Documents grid. For each token, the number of occurrences in the Positive and Negative Corpus overall is displayed. Count in Positive Corpus will match that of Positive Hits and Count in Negative Corpus will match that of Negative Hits in the Tokens panel.
Note: Any tokens appearing more than once in the selected document will be listed multiple times in the Document Probability panel.
History#
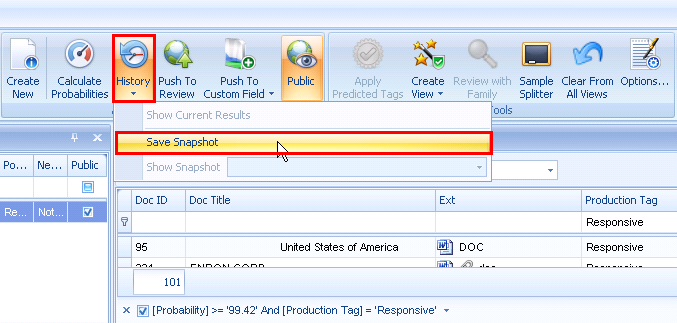
Viewpoint allows creating a snapshot of all the corresponding reports associated with the current Model and its predictions. Once created, the results can be referenced after adjustments have been made to the model, so that Model iterations can be compared. Multiple snapshots can be created for an assisted review set.
- Select the History icon from the tool bar and then select Save Snapshot.
- Give the snapshot a description and select OK.
- To reference a saved snapshot, select desired snapshot from the Show Snapshot pick list.
- To refresh the reports to the most recent Model and iteration, select Show Current Results.
Populating Predictions to Review#
Once predictions have been validated and accepted, they can be made available to reviewers within the review tool. There are multiple options for populating the predicted values and probability scores to Review.
Public#
Assisted Review Set probability scores and predicted tags are, by default, only visible in the Target view when the ‘Public’ option is set. Only one Assisted Review set may be set to Public at any given time. Choosing this option will make the probability scores for this Assisted Review set accessible from within the selected Target View.
Push to Review#
The ‘Push To Review’ icon from the tool bar will populate the AR Probability and AR Predicted Tag fields within Review and will make them visible on the document regardless of which View is being accessed. This option will override any of the scores published through the ‘Public’ option.
Push to Custom Field#
The ‘Push To Custom Field’ icon from the tool bar allows users to push the Probability and Predicted Tag values to custom fields within Review. This is often helpful where users wish to display multiple Assisted Review Set probabilities simultaneously within the same project.
Tools#
Apply Predicted Tags#
To apply the Predicted Tags determined by Assisted Review, first filter the grid by those documents to which predictions will be applied. You are not forced to apply predictions to the entire Target View. A typical filter will involve the Probability field where the Review team has determined a specific probability threshold for which they are comfortable applying Predicted Tags. All remaining documents outside of this threshold will need to be batched for manual review or can be individually tagged with the Tags panel in the Assisted Review window.
Once your filter is set, highlight or check all documents in the grid. Go to the Actions menu and select Apply Predicted Tags. The Predicted Tag assigned to each document will correspond with the values you inputted for the Negative and Positive Score settings.
Create View#
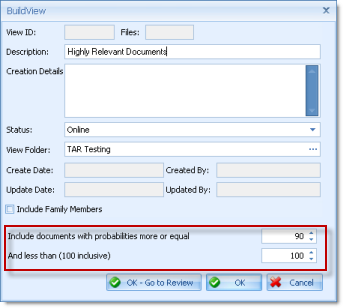
The Create View option allows a user to create a View by either selecting documents in the Documents grid, or by specifying the range of probability values the user wishes to be contained in the resulting view.
Review#
This option will open the linear Review module to an ad-hoc View containing documents selected in the VAR Documents grid.
Sample Splitter#
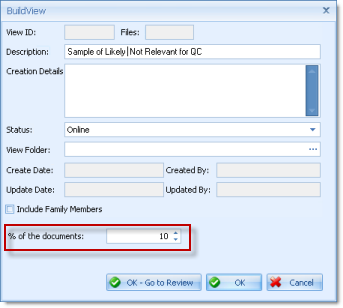
Optionally, for additional validation of Assisted Review’s predictions, you may build a random sample of your Target View for QC or other purposes by using the Sample Splitter tool. Choosing this option will open a Build View window where the user may specify the percentage of the documents selected in the Documents grid to randomly be populated to a sample View:
Clear From All Views#
This option will clear existing Predicted Tags and Probability scores from the selected Assisted Review set from all views containing those values.
Options#
This button will open the Options menu with the Assisted Review options displayed.
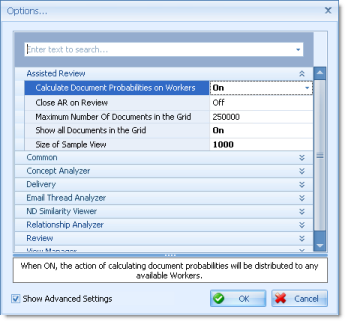
- Calculate Document Probabilities on Workers: When ON, the action of calculating document probabilities will be distributed to any available workers.
- Close AR on Review: When ON, the Assisted Review window will close when you select ‘Review’ or when you go directly to Review from the Build View window.
- Maximum Number of Documents in the Grid: Defines the maximum number of documents to appear in the VAR Documents grid. Generally, we do not recommend more than 250,000 documents be displayed.
- Show all Documents in the Grid: If the number of documents displayed in the Documents grid for the selected View is less than the maximum grid number option, documents that were not processed for Assisted Review will be listed (i.e., documents that were added after probabilities were calculated, have no text or were skipped for other reasons.
- Size of Sample View: Size of the Sample View to be generated to determine the rate of positive documents in the Source/Target view. 1,000 is the minimum value.
Advanced Settings#
Build Seed View Advanced Options#
- Document Tagging Method: Designate if the Sample View was tagged based on family level or individual calls. If documents were tagged on a family level, setting this to Family Level Tagging will only include loose documents into your resulting Seed View. It will exclude any document that is part of a family.
- Include OCR’d Documents: By default OCR’d documents are not included in the Assisted Review analysis due to the prevalence of poor quality text files created through any OCR engine.
- Sample from Non-Message Emails: This option controls whether or not non-message emails (i.e., calendar invites, contacts, etc.) will be included in the analysis.
Build Model Advanced Options#
- Defines calculation of Beta constant used in Tempered EM: Set to None defines optimistic approach when beta equals 1 and no calibration is needed. Set to Constant defines the pessimistic approach when beta is fixed. Set to Auto defines a balanced approach when beta is calculated at run-time.
- Maximum number of tokens per document: Define the maximum number of tokens per document. Any document from the Seed View containing more tokens will not be considered in the analysis and will be excluded from the model.
- Minimum Token Length: Define the minimum number of characters required to consider a string a token.
- Seed View Ratio Control: Dictates that the Model must contain a certain percentage of either positive or negative tags, therefore, preventing the Model from being too heavily weighted one way or the other. For example, setting this option to 10 would indicate that positive documents should comprise 10% of the model. Thus if there were 100 positive documents and 5,000 negative documents in the Seed View, the Model would use only 900 of the negative documents. 0 means to use all documents available.
Note: This option will control the number of positive or negative documents, regardless of which one prevails.
- Stemming: Apply normal stemming additions for identified tokens to the analysis.
- Use Token Weights: When set to True, tokens appearing in small numbers relative to others will be ignored.
- Use Word Breaker for CJK: When set to Yes and the language of a document was identified as either Chinese, Japanese or Korean (CJK), the system will use parse the text into words.
- Specify tokens to be excluded from model: Input any specific tokens to be excluded from the analysis. If these tokens appear in your seed set documents, the tokens won’t be included in the analysis and will be excluded from the model.
- Specify tokens to be included from model: Input any specific tokens to be included in the analysis that would normally be ignored (e.g., social security numbers containing only digits).
- Specify text blocks to be excluded from model: Input entire text blocks to be excluded from the analysis and resulting model. An example would be long email signatures required by corporate legal departments.
Calculate Probabilities Advanced Options#
- Document Tagging Method: Designate if the Sample View or Seed View was tagged based on family level or individual calls. Set to Family Level Tagging, only loose documents or single family documents will have probabilities applied. Set to Doc Level Tagging, all documents will have a probability applied.
- Emails of Thread Considered Separate Documents: Break apart single email files into distinct sub components. Each sub component will represent one of the individual emails which make up the larger thread contained in that single file. If this option is set to Yes, an average of each e-mail’s probability will be used for the overall document probability.
- Minimum Unique Token Count per Email Block: Define the minimum number of tokens required for a reply/forward section of a larger email or the entirety of a non-email message document to be considered in analysis.
- Negative Score (0-49): Probability threshold of a document receiving a negative tag designation. For example, a value of 20 will mean that any document with a probability of 20% or lower will be assigned the negative tag as its Predicted Tag.
- Positive Score (50-100): Probability threshold of a document receiving a positive tag designation. For example, a value of 80 will mean that any document with a probability of 80% or higher will be assigned the positive tag as its Predicted Tag.
- Sample from Non-Message Emails: This option controls whether or not non-message emails (i.e., calendar invites, contacts, etc.) will have a probability applied. Set to No, non-message email documents will not have a probability applied.