
Sections Reports Manual
Manual informationReports Manual
1.1 | August 27, 2021 | Rebranded adhering to the latest Conduent brand central documentation standards/guidelines. | Technical Writer
Document conventions
Convention | Explanation |
|---|---|
Bold | For file names, commands, fields, menus, options, and window names. |
Courier New | Commands as you should type them. |
Lucida Console | Example output generated by the system. |
Italics | For configuration variables, including variable portions of file names and URLs. Also indicates a document name. |
Note / Blue Callout | The Blue Callout text indicates information that is of special interest or importance, an idea that could be useful or additional information about a product or a feature. |
| The Caution icon along with the text indicates actions that can lead to problems in system operation or configuration settings if the instructions are not followed properly. |

Revision history
This section tracks the initial creation of the document after each major version thereafter.
Ver: | Date | Description | Reviewed / Approved By |
|---|---|---|---|
1.0 | Feb 28, 2020 | Initial Version | Team |
1.1 | August 27, 2021 | Rebranded adhering to the latest Conduent brand central documentation standards/guidelines. | Technical Writer |
Viewpoint Reports#
Opening the Reports Module#
The Reports module can be launched from both the Review and Processing applications. The user should have the Access Reports permission to use the Reports module and as well as the Customize Reports permission to make changes to the reports.
- Processing: Select the Reports button from the Project tab.
- Review: Select the Reports button from the Tools section of the main Review window, as shown in the following screen:
Ribbon Menu#
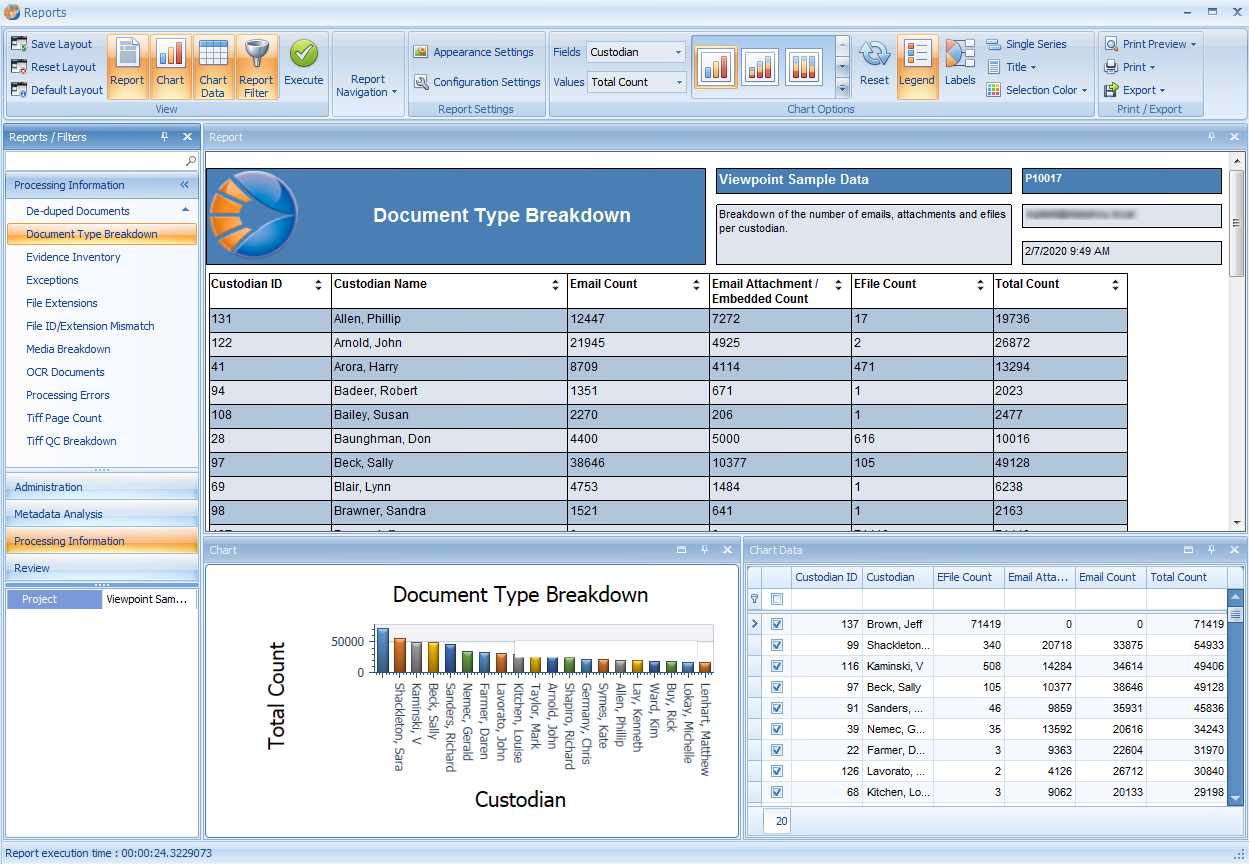
The Ribbon is divided into five sections that allow the user to work with various panels in the Reports window.
The icons will automatically resize depending on the size of the Reports window.
View#
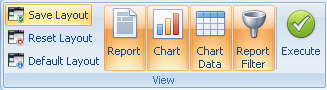
The View section controls what panels are currently visible within the Reports window as well as the ability to save or reset the current layout. The Execute button kicks off the report generation. The time required to generate a report can vary greatly depending on the selected report and the filters used. Alternatively, users can double-click on a selected report in the Reports / Filters panel to execute the report.
Report Navigation#
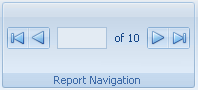
This section allows the user to navigate through the report displayed in the Report panel.
Report Settings#
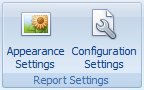
The Report Settings section allows the user to change the look and feel of generated reports. This section is also used to change the behavior of the filter settings.
Appearance Settings#
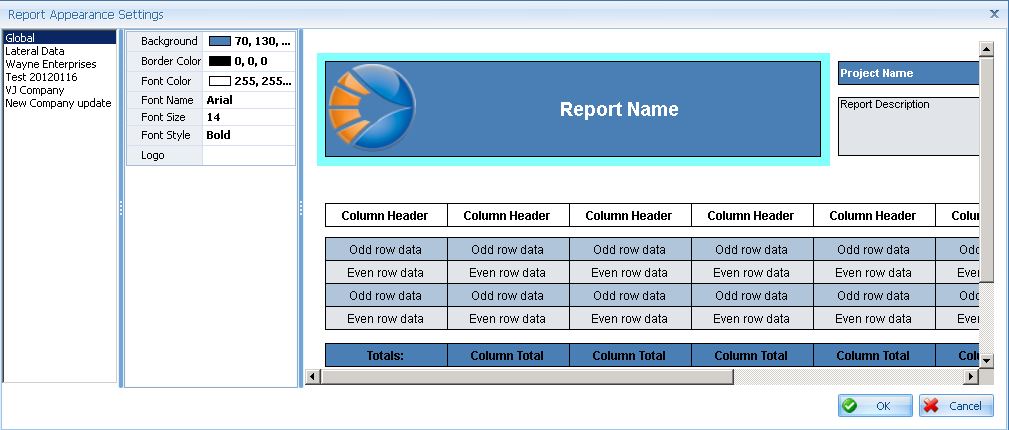
The look and feel of a report can be altered for each Company listed within the Viewpoint. The Appearance Settings button is only active, if the user has been granted the Customize Reports permission in the Security Management module.
- To use this tool, the user selects which company’s report template to be customized from the left side.
- Click the section in the template pane to highlight the section. It will populate the middle pane with the settings that can be altered.
- To change the logo in the report template, click the Logo field in the middle pane and browse to the file location of the new logo file.
- It is recommended to use a square .png file with a dimension of at least 60X60 and a transparent background.
- The size of the logo will be scaled automatically to fit the space predefined for the logo.
Configuration Settings#
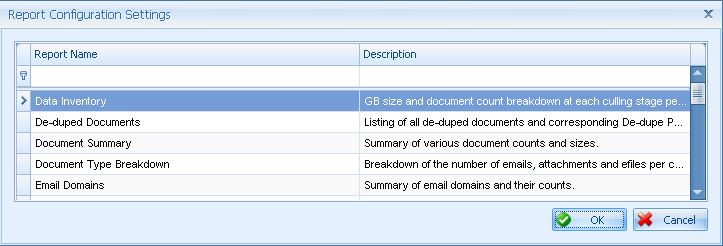
- This button is only active if the user has been granted the Customize Reports permission in the Security Management module.
- The Configuration Settings button allows the user to edit the name and description of the various reports.
- The user can simply click the field and change the existing text.
- Clicking OK to save the changes.
- These changes will be reflected in the report name in the Report Filter panel and in the report name and description values in the generated reports.
Chart Options#

- This section allows the user to make the changes and see how the chart is organized and displayed.
- Not all the reports have an available chart. As a result, this section will only be visible if the selected report can generate a chart.
Fields, Values, and Aggregation#
Some charts allow the user to have some flexibility and to select which fields of the report are visible in the chart. Fields options are typically listed on the horizontal axis, while Values options are typically listed on the vertical axis. For reports where results are grouped by date, the Aggregation option will appear and allow the user to group the results based on day, month, year, etc.
Chart Type#
There are nine chart types to choose from the available list to represent the data. Hovering over the chart type will display the chart name. When you select a different chart type, it will immediately update the chart without having to regenerate the report.
Reset, Legend, Labels, Single Series, and Title#
The Reset button will revert the chart back to the original zoom, legend selection, and chart filters. The Legend and Labels buttons will toggle on/off the chart legend and data labels. The Title option allows the user to change the title at the top of the chart or hide it completely.
The Single Series button toggles on/off how the right-click Review option behaves in the Chart panel. There are some charts that can have multiple categories for each Value displayed in the chart.
For example, chart for the File Extensions report can show the number of cataloged files, extracted files, and the files after dedupe for each file extension listed on the graph. With Single Series turned off, right-click Review will display the results for all the categories of the file extension lumped together. With Single Series turned on, right-click Review will display only the results for the individual selected category for the file extension in the graph.
The Selection Color button provides the ability to change the color of a graph category when you click on. Using ctrl+click to select multiple categories will turn the color of the selected categories to the color chosen in this setting. This is meant to avoid confusion of which categories are selected when a category in the graph has the same color as the default selection color.
Print / Export#
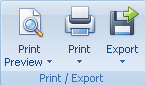
Print Preview gives the option to preview either the report or the chart.
Print gives the option to print either the report or the chart. Selecting either one will open the printer settings where the user can select a printer.
Export allows the user to export out the report into Microsoft Excel (with or without the header), PDF, or Word formats. Alternatively, the Chart Data (Grid option) will export either all rows or only checked rows of the Chart Data panel to Excel.
Reports / Filters Panel#
This is the left-most panel, by default. The reports are separated into several categories. When a category is selected, the list of reports are displayed in the upper portion of the panel. A list of available filters are displayed in the bottom section of the panel for the report selected. A complete list of the reports available in the Processing and Review applications are available at the end of this manual.
For users with the Securable Lookup permission, right-click on a report in the panel will give the option to view the Security Access to the report. Security Access is a quick way to see which users have permissions to view and/or customize the report.
Reports Panel#
This is the main panel in the window. The panel will remain blank until a report is generated. There are a few right-click options that give the user the ability to print, export, zoom, or change the page setup.
Users can also sort columns of generated reports prior to exporting by clicking the Sort icon located on the right side of each column header.
Chart Panel#
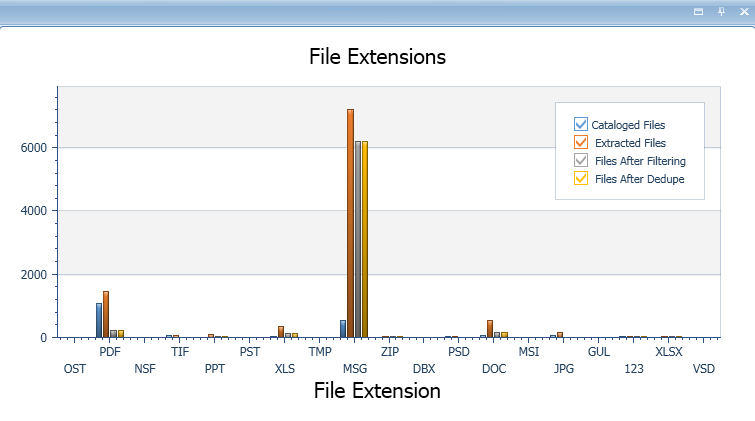
This panel can be toggled on/off by clicking the Chart button on the Ribbon menu. Once a report has been generated, the chart will display in this panel. Right-click in the panel will give the option to review the selected section of the chart. If this is done in the Processing Reports module, a search results grid will open in the Process tab displaying the records of the selected section of the chart.
In the Review Reports module, choosing the Review option will create a View in the Adhoc folder. Also, in the Review Reports, there is an option to create a View from the chart. This will open a new window where the user can name the View and decide which folder to build it in.
To build a View or review multiple categories of a graph, ctrl+click to select the desired categories and then right-click to select either Review or Create View. Right-click on the chart to copy the chart to the clipboard, as well as to filter the Chart Data panel to the chart value selected.
Note: Refer to the section in this manual that covers the Single Series button, as this may have an effect on the number of files that are displayed in the results for graph values with multiple categories when using the Review or Build View right-click options.
Chart Data Panel#
The Chart Data panel lists the data that is used to generate the chart. All the available field values for the chart will be listed. Checking/unchecking records in this panel will instantly add/remove the record from the chart. The chart data can be exported to Excel using the right-click option.
Available Reports#
Reports in the Processing Application#
Processing Reports | ||
|---|---|---|
Report | Description | Filter Options |
Administration | ||
Environment Statistics | Breakdown of the software installed on each hardware component part of Viewpoint infrastructure. | None |
Global Billing | Breakdown of various categories of data counts and sizes for all Projects. | Date Range, Projects, Date Range |
Inactive Users | Listing of inactive users for a specified time period. | Minimum Number of Days |
Monthly Invoice | Up-to-date report of data volumes to be used in calculating invoice for current month. | Date Range, Dedupe Option |
New Users | Listing of new users created after specified date. | Created After Date |
Metadata Analysis | ||
Email Domains | Breakdown of the From, To, CC and BCC counts per domain. | Project |
Email Sent Date Statistics | Breakdown of the number of emails sent per year and month. | Project, Custodian, Scope, Dedupe Set, Date Range, Group By |
Processing Information | ||
Data Inventory | Gigabyte size and document count breakdown at each culling stage per Media. | Project, Custodian, Scope, Medias, Dedupe Set, Actual/Billable Files and Size, Date Range, Group By |
De-duped Documents | Listing of all de-duped documents and corresponding De-dupe Parent per Custodian. | Project, Dedupe Set |
Document Type Breakdown | Breakdown of the number of emails, attachments and efiles per Custodian. | Project |
Evidence Inventory | Listing of each media, corresponding custodian, media description and stage date. | Project, Custodian, Scope, Medias |
Exceptions | Listing of all files which were ignored or slipsheeted. | Project, Custodian, Scope, Medias |
File Extensions | Breakdown of each file extension and corresponding size and document count. | Project |
File ID/Extension Mismatch | Listing of all documents in which the extension does not match the file id. | Project |
Media Breakdown | Listing of parent medias with sub directory folder paths. | Project |
OCR Documents | Listing of all documents with OCR run against. | Project |
Processing Errors | Listing of all processing errors per Doc ID. Organized by Custodian and further segregated by processing stage. | Project, Custodian, Scope, Medias, Dedupe Set, Error Option |
Tiff Page Count | Number of documents tiffed and corresponding page count. | Project, Date Range |
TIFF QC Breakdown | Listing of all documents with TIFF QC status as "New" or "Bad". These documents require attention before delivery. | Project |
Review | ||
Document Summary | Breakdown of various document counts and sizes per Scope. | Project, Custodian, Scope, Dedupe Set |
Redaction QC | Quality control check for redacted documents. | Project, Issue Tag(s) |
Reports in the Review Application#
Review Reports | ||
|---|---|---|
Report | Description | Filter Options |
Administration | ||
Environment Statistics | Breakdown of the software installed on each hardware component part of Viewpoint infrastructure. | None |
Hosted Data | Breakdown of the documents in the Review database marked as billable or other View Type. | View Type |
Inactive Users | Listing of inactive users for a specified time period. | Minimum Number of Days |
New Users | Listing of new users created after specified date. | Created After Date |
Delivery | ||
Deliveries | Listing of all deliveries and corresponding details. | Project, Deliver, Date Range |
Pre-Delivery | Summary of document counts by type, Production and Issue Tag stats and potential delivery format issues. | Project, All Views, View, Form |
Metadata Analysis | ||
Document Date Statistics | Breakdown of the number of documents per create year. | Project, All Views, View, Custodian, Scope, Date Range, Group By |
Email Domains | Breakdown of the From, To, CC and BCC counts per domain. | Project, All Views, View |
Email Sent Date Statistics | Breakdown of the number of emails sent per year and month. | Project, All Views, View, Custodian, Scope, Dedupe Set, Date Range, Group By |
Field Tally | Summary of field values and their counts. | Project, View, Form, Field |
Keyword Hit List By Custodian | Keyword Hit List Report broken down by Custodian. | Project, Custodian, View |
Keyword Hit List By Production Tag | Keyword hit list of a selected View broken down by production tag. | Project, View, Form, Include Family Member |
Keyword Hit List By View | Keyword hit list report per specified View(s). | Project, View |
Language Identification | Number of documents identified with each language or combination of languages. | Project, All Views, View |
Word List | Listing of all words of indexes | Project, Scope, Max Words, Exclude Numeric Results |
Processing Information | ||
Data Inventory | Gigabyte size and document count breakdown at each culling stage per Media. | Project, All Views, View, Custodians, Scope, Medias, Dedupe Set, Deliveries, Actual/Billable Files and Size, Date Range, Group By |
De-duped Documents | Listing of all de-duped documents and corresponding De-dupe Parent per Custodian. | Project, Dedupe Set |
Documents with no Text | Listing of all documents without a corresponding text file. | Project, All Views, View, Custodians, Scope, Medias |
Exceptions | Listing of all files which were ignored or slipsheeted. | Project, View, Custodians, Scope, Medias |
File Extensions per View | Breakdown of each file extension and corresponding document count per View. | Project, View |
Media Size | Listing of all media and corresponding megabyte size. | Project, All Views, View |
Non-Indexed Documents | Listing of all documents that have an index status of error. | Project, All Views, View, Custodian, Scope, Medias |
TIFF QC Breakdown | Listing of all documents with TIFF QC status as 'New' or 'Bad'. These documents require attention before delivery. | Project, View |
Review | ||
Automation History | History of all views checked out/in by users. | Project, Project Access, Role, Username, Date Range |
Checked Out Documents | Number of documents checked out per reviewer. | Project |
Deleted Views | Listing of all deleted Views, who deleted them and when. | Project |
DocID / View ID | List of View IDs that share documents with the selected View | Project, View, Locked View |
Document History | Full document history per specified time period. | Project, All Views, View, Date Range |
Issue Tag History | Breakdown of all Issue Tag changes per document. | Project, All Views, View, DocID, Min. # of Changes |
ND Production Tag Conflicts | Listing of ND groups with conflicting Production Tags. | Project, All Views, View, Custodians, Scope |
Organization Code Count | Number of documents tagged per Organization Code. | Project |
Production Tag Conflict | Listing of families with conflicting Production Tags. | Project, All Views, View, Custodians, Scope, Conflicts Outside of View |
Production Tag History | Breakdown of all Production Tag changes per document. | Project, All Views, View, DocID, Min. # of Changes |
Project Tag Statistics | Document percentage breakdown per Production Tag and Issue Tag. | Project, All Views, View |
Redaction QC | Quality control check for redacted documents. | Project, View, Form, Issue Tag(s) |
Reviewer Confidence | Number of times the Production Tag was changed per document. | Project, All Views, View |
Reviewer Productivity (All Tags) | Number of documents tagged with specified Production and Issue Tags per reviewer, per day. | Project, All Views, View, Issue Tags, Production Tags, Date Range, Users with Project Access, Role, Username |
Reviewer Productivity (Issue Tag) | Number of documents tagged with each Issue Tag per reviewer, per day. | Project, All Views, View, Date Range, Users with Project Access, Role, Username |
Reviewer Productivity (Production Tag) | Number of documents tagged with each Production Tag per reviewer, per day. | Project, All Views, View, Date Range, Users with Project Access, Role, Username |
Tagging Breakdown | Breakdown of the number of documents tagged with a specific Production Tag and nested Issue Tags. | Project, All Views, View, Custodian, Form |
User Productivity | Listing of the log in and log out times for a given user(s) per session. | Project, Date Range, Users with Project Access, Role, Username |
View Breakdown | Listing of each View and corresponding folder path. | Project |
View Criteria | Listing of criteria used to build a View | Project, View |